The busy person's intro to AB Testing
Why we need AB Testing?
I'm sure many of you have been in this situation at work: Different stakeholders come up with different ideas, and they all seem to make sense. But when it's time to decide, it's hard to pick the best one.
Take Synchrony's landing page call-to-action (CTA) as an example. Imagine we have two versions:
- One says "Claim limited-time offer" — this creates urgency and pushes users to act fast.
- The other says "Start Saving Today" — this highlights the value users get by clicking.
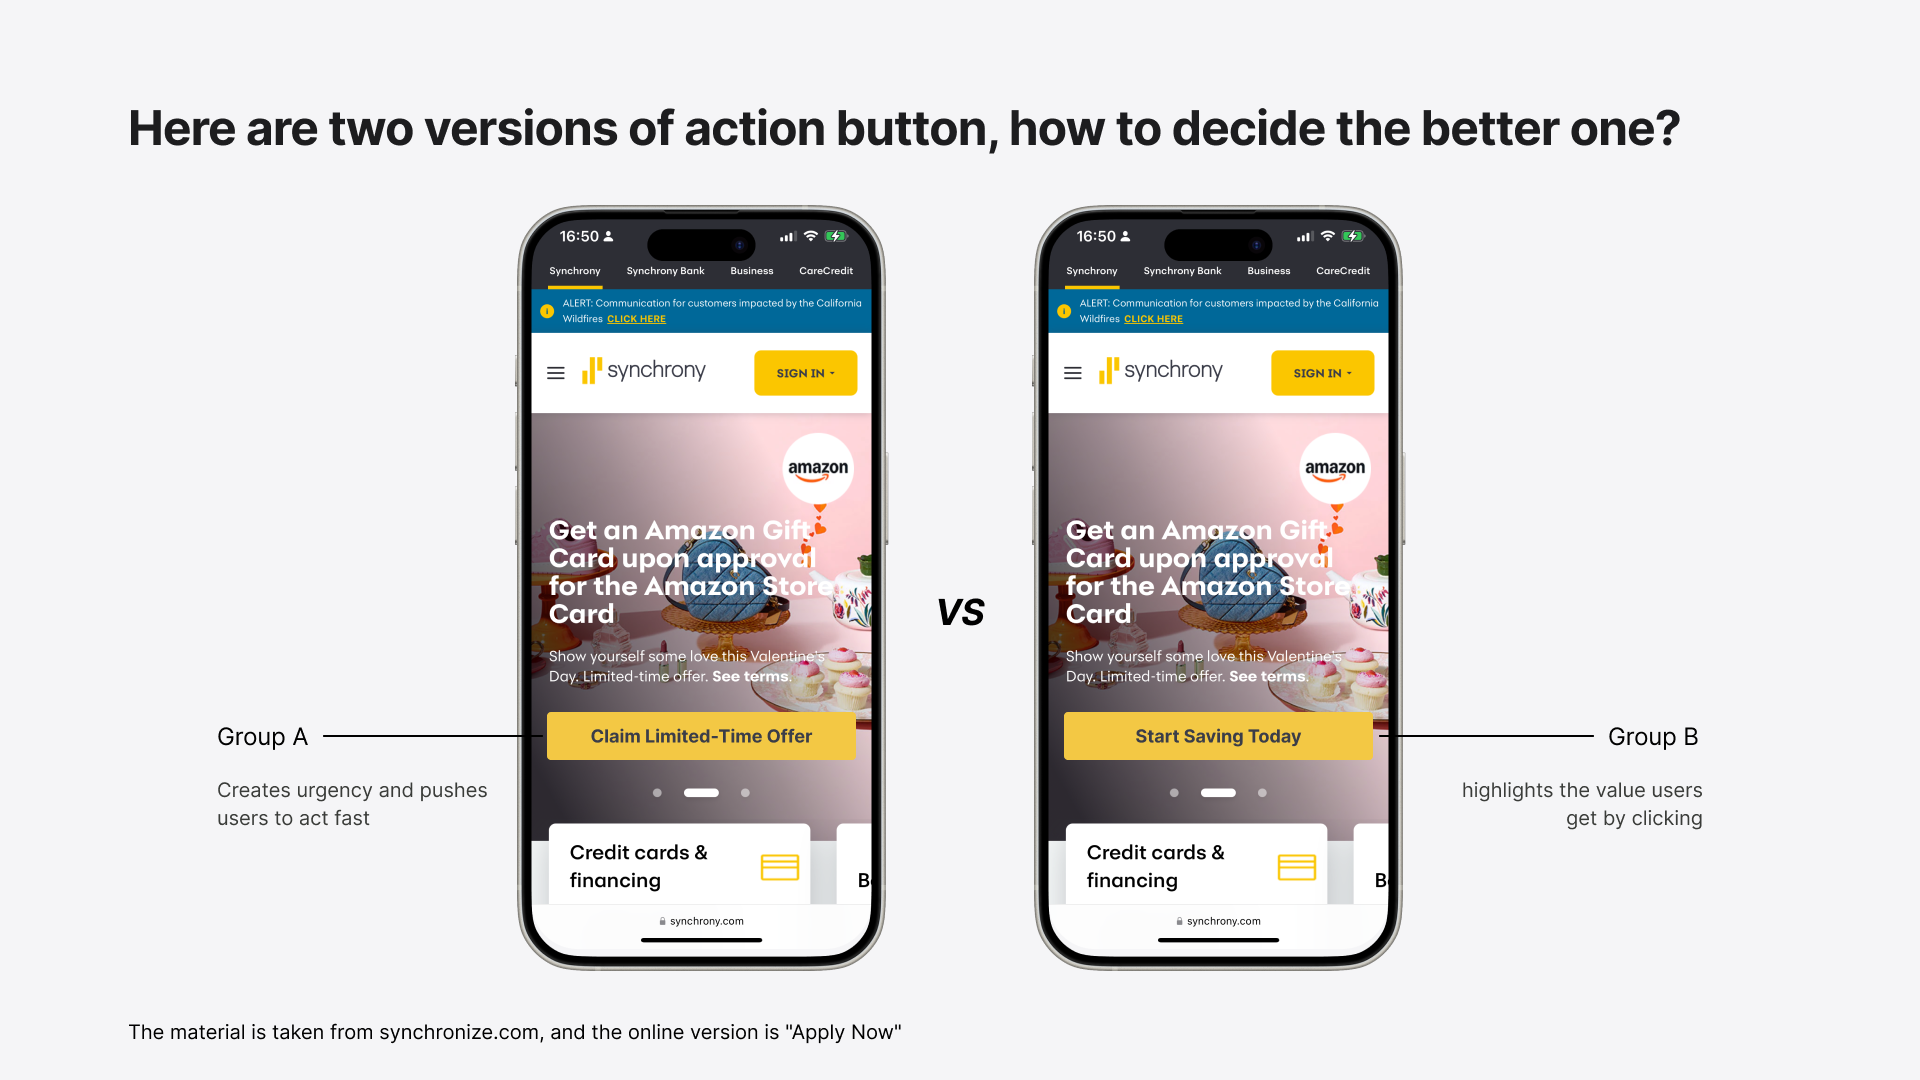
Both sound like good choices, right? So, which one actually works better?
That's exactly why A/B testing exists. It helps us take the guesswork out of decision-making.
Workflow of AB Testing
When setting up an experiment, the most important step is defining a clear goal. We do this using two key metrics:
- Conversion Metric – measures the positive impact of a strategy.
- Guardrail Metric – ensures the strategy doesn't hurt the business in unexpected ways. If it causes too much harm, we might need to stop the experiment early.
The process is actually pretty simple:
- We randomly split users into two groups, usually 50/50.
- We roll out the changes and let the test run for a set period.
Finally, we compare the results:
If Group A shows a significant improvement in the Conversion Metric and the Guardrail Metric remains stable, → Then we can accept the new version!
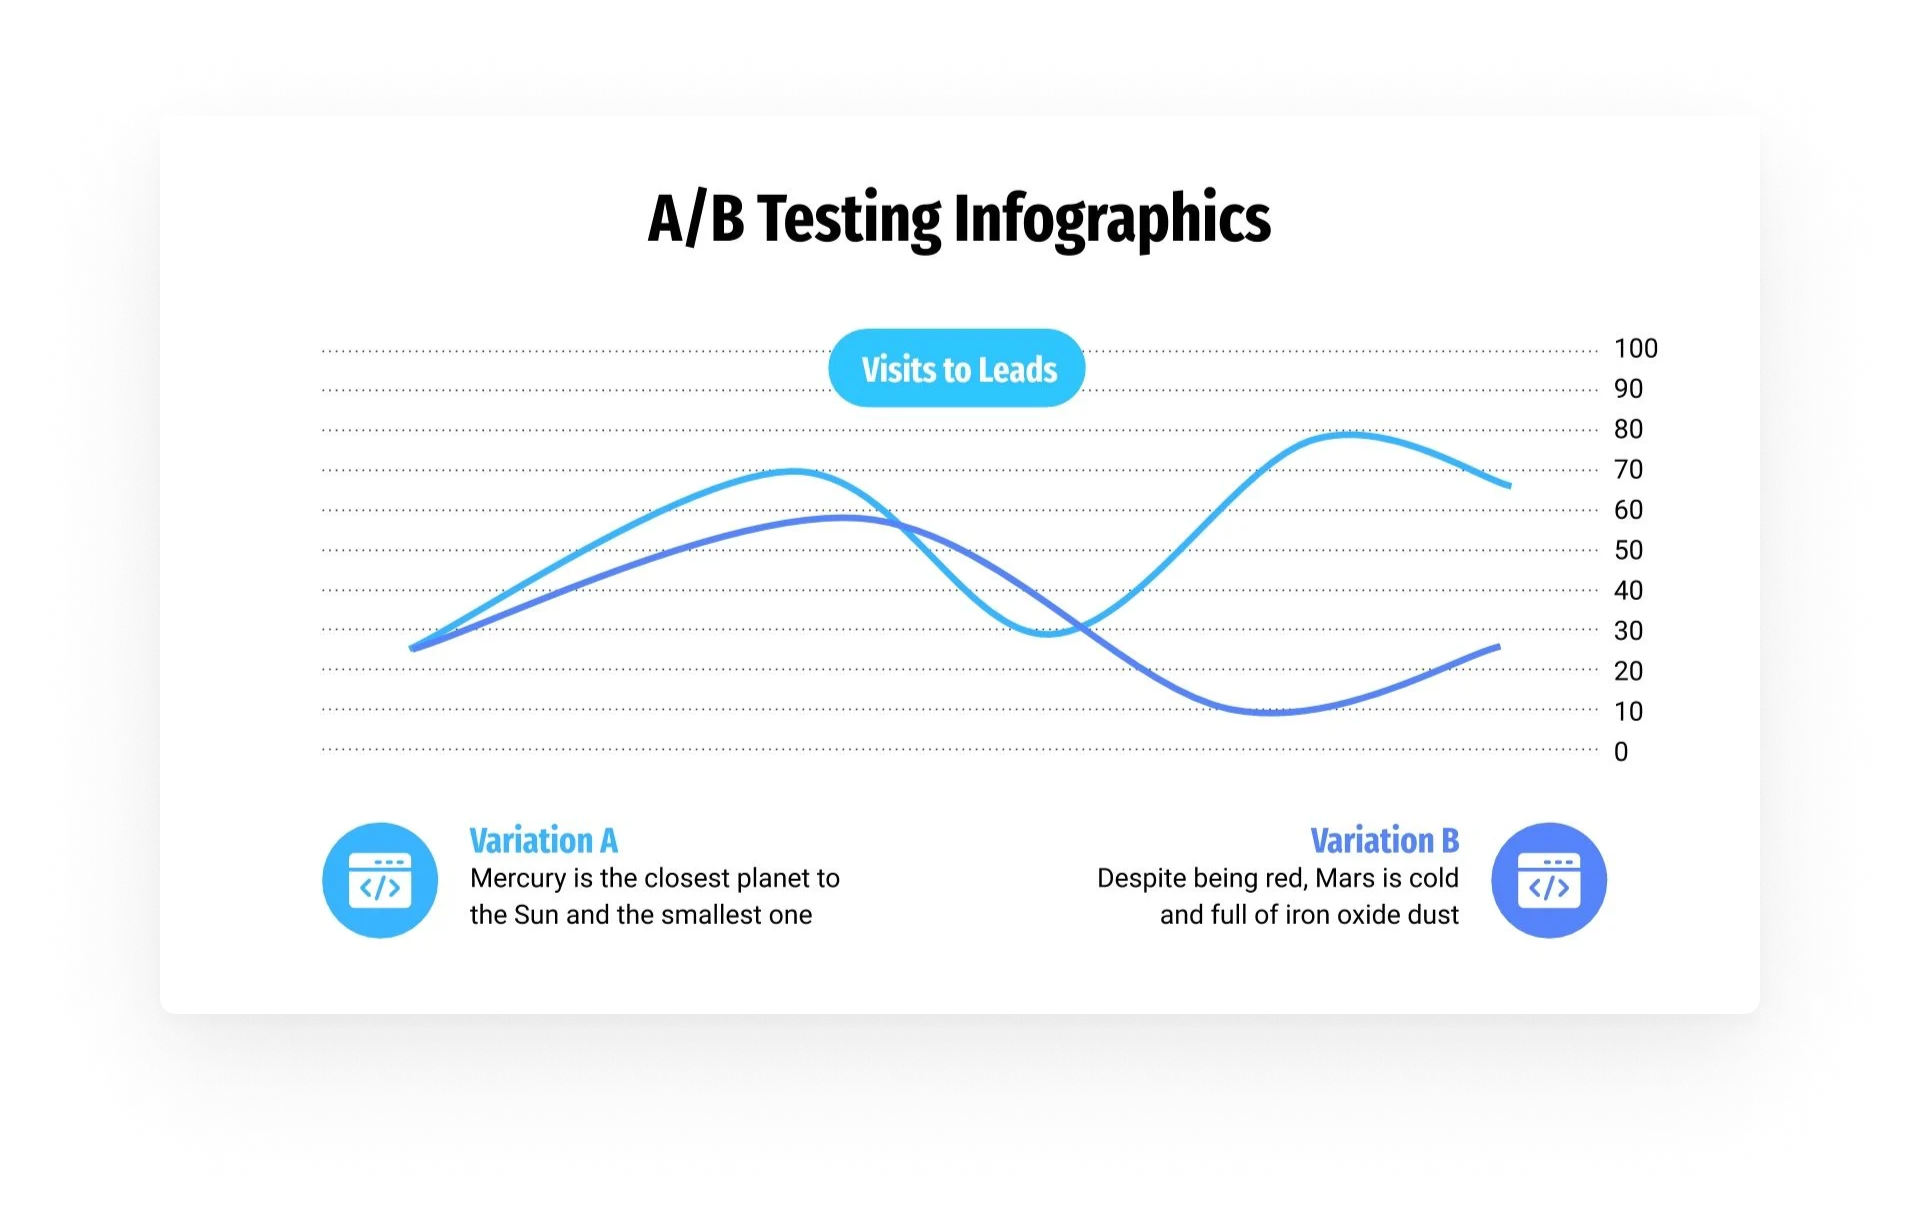
Let's take a look, at the end of the test:
- Group A's Conversion Metric (click-through rate) is higher than Group B's.
- But… Group A's Guardrail Metric also increased, which means might have negative effects.
So, would you accept Group A's results?
Challenges You May Face in Practice
In reality, running an A/B test isn't always straightforward. There are two big challenges in practice
- Keeping the Two Groups Independent This means, Group A's results shouldn't be influenced by Group B. If they are, we can't say for sure that Group A's strategy is actually working.
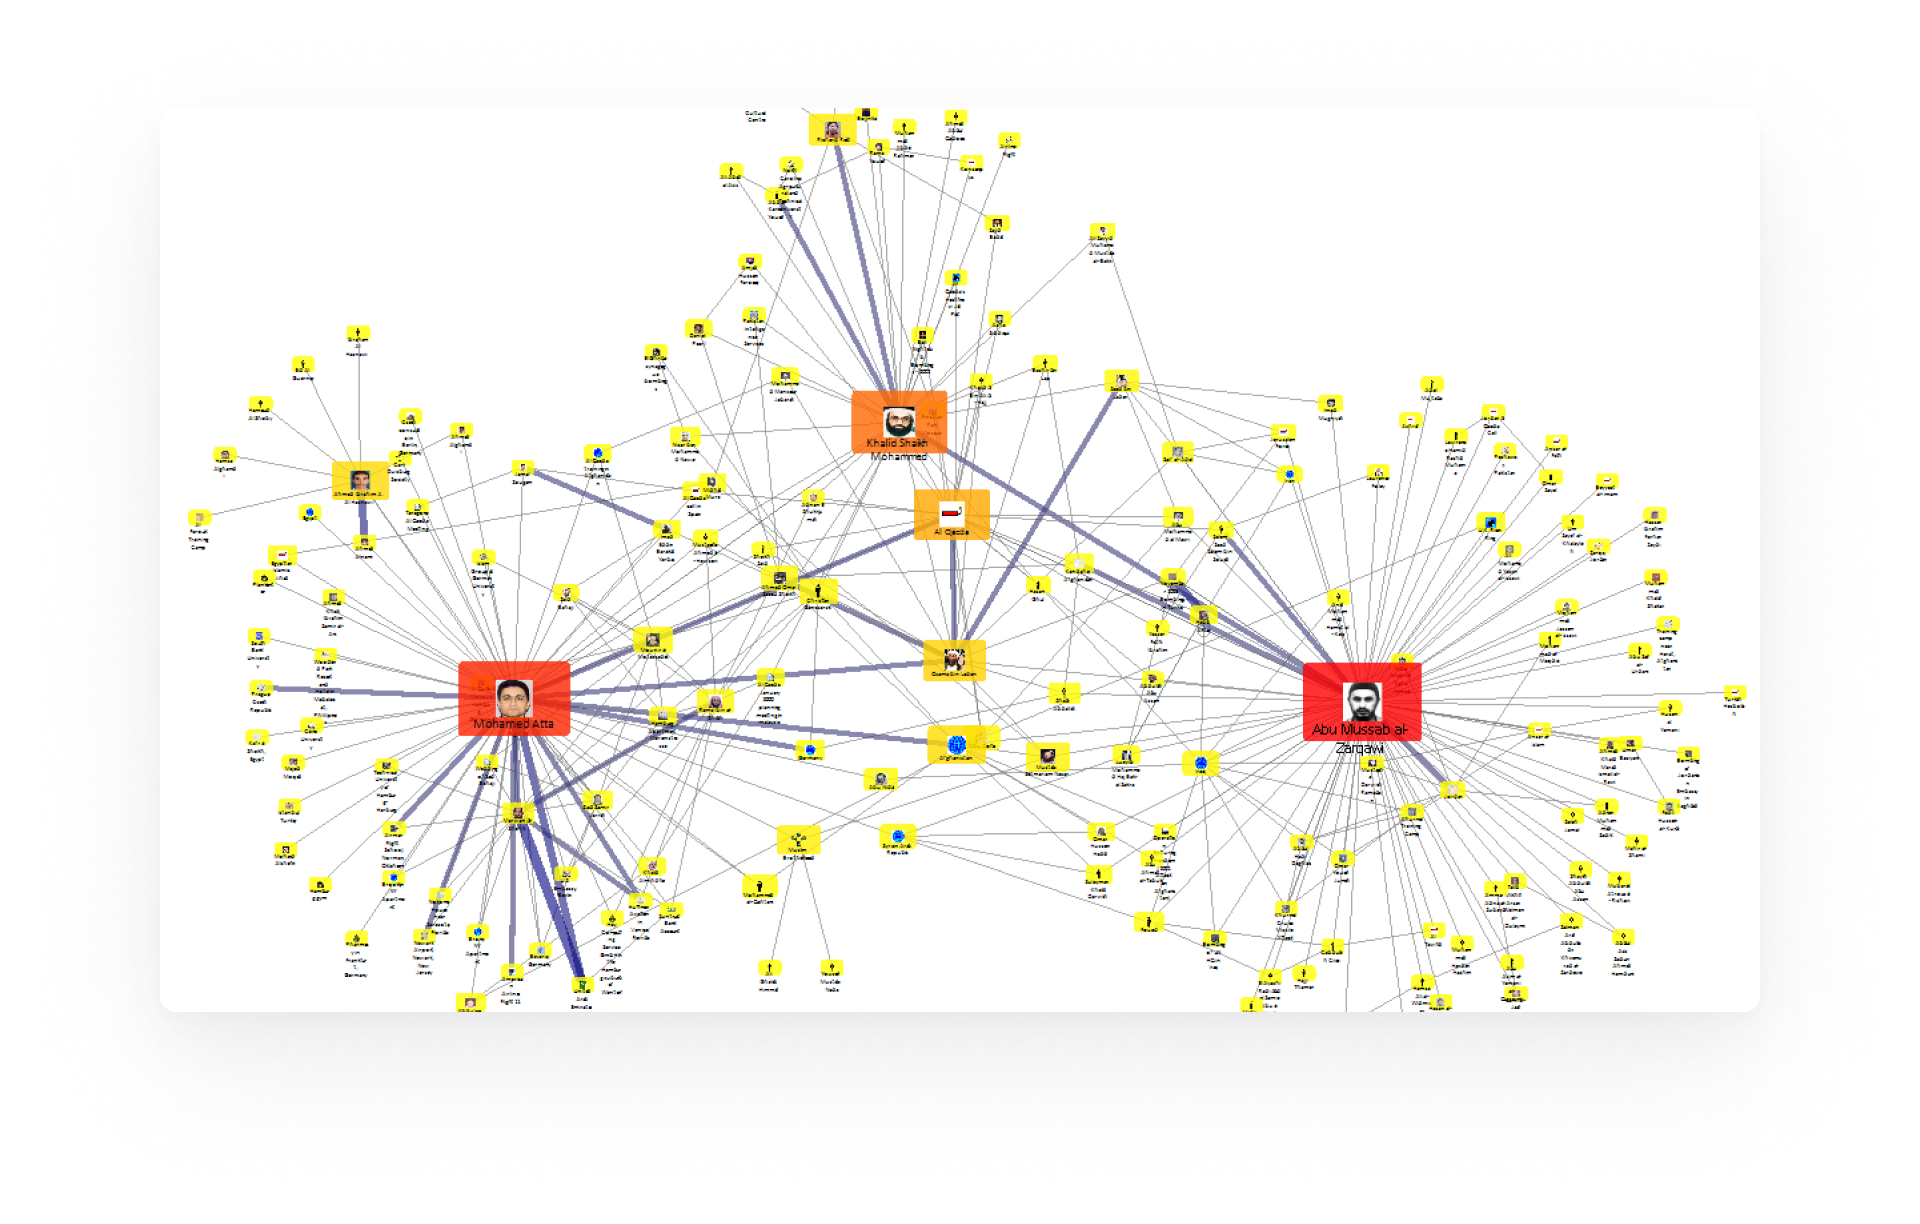
This issue is especially tricky in social networks or two-sided marketplaces like Uber, where users interact.
If we change something for drivers, it might also affect riders—which means the two groups aren't truly independent.
- Making Sure the Change Isn't Just Random Fluctuation
Real-world data is never a straight line. Metrics naturally fluctuate over time.
So, how do we know that an increase (or drop) in a metric happened because of our strategy and not just random noise?
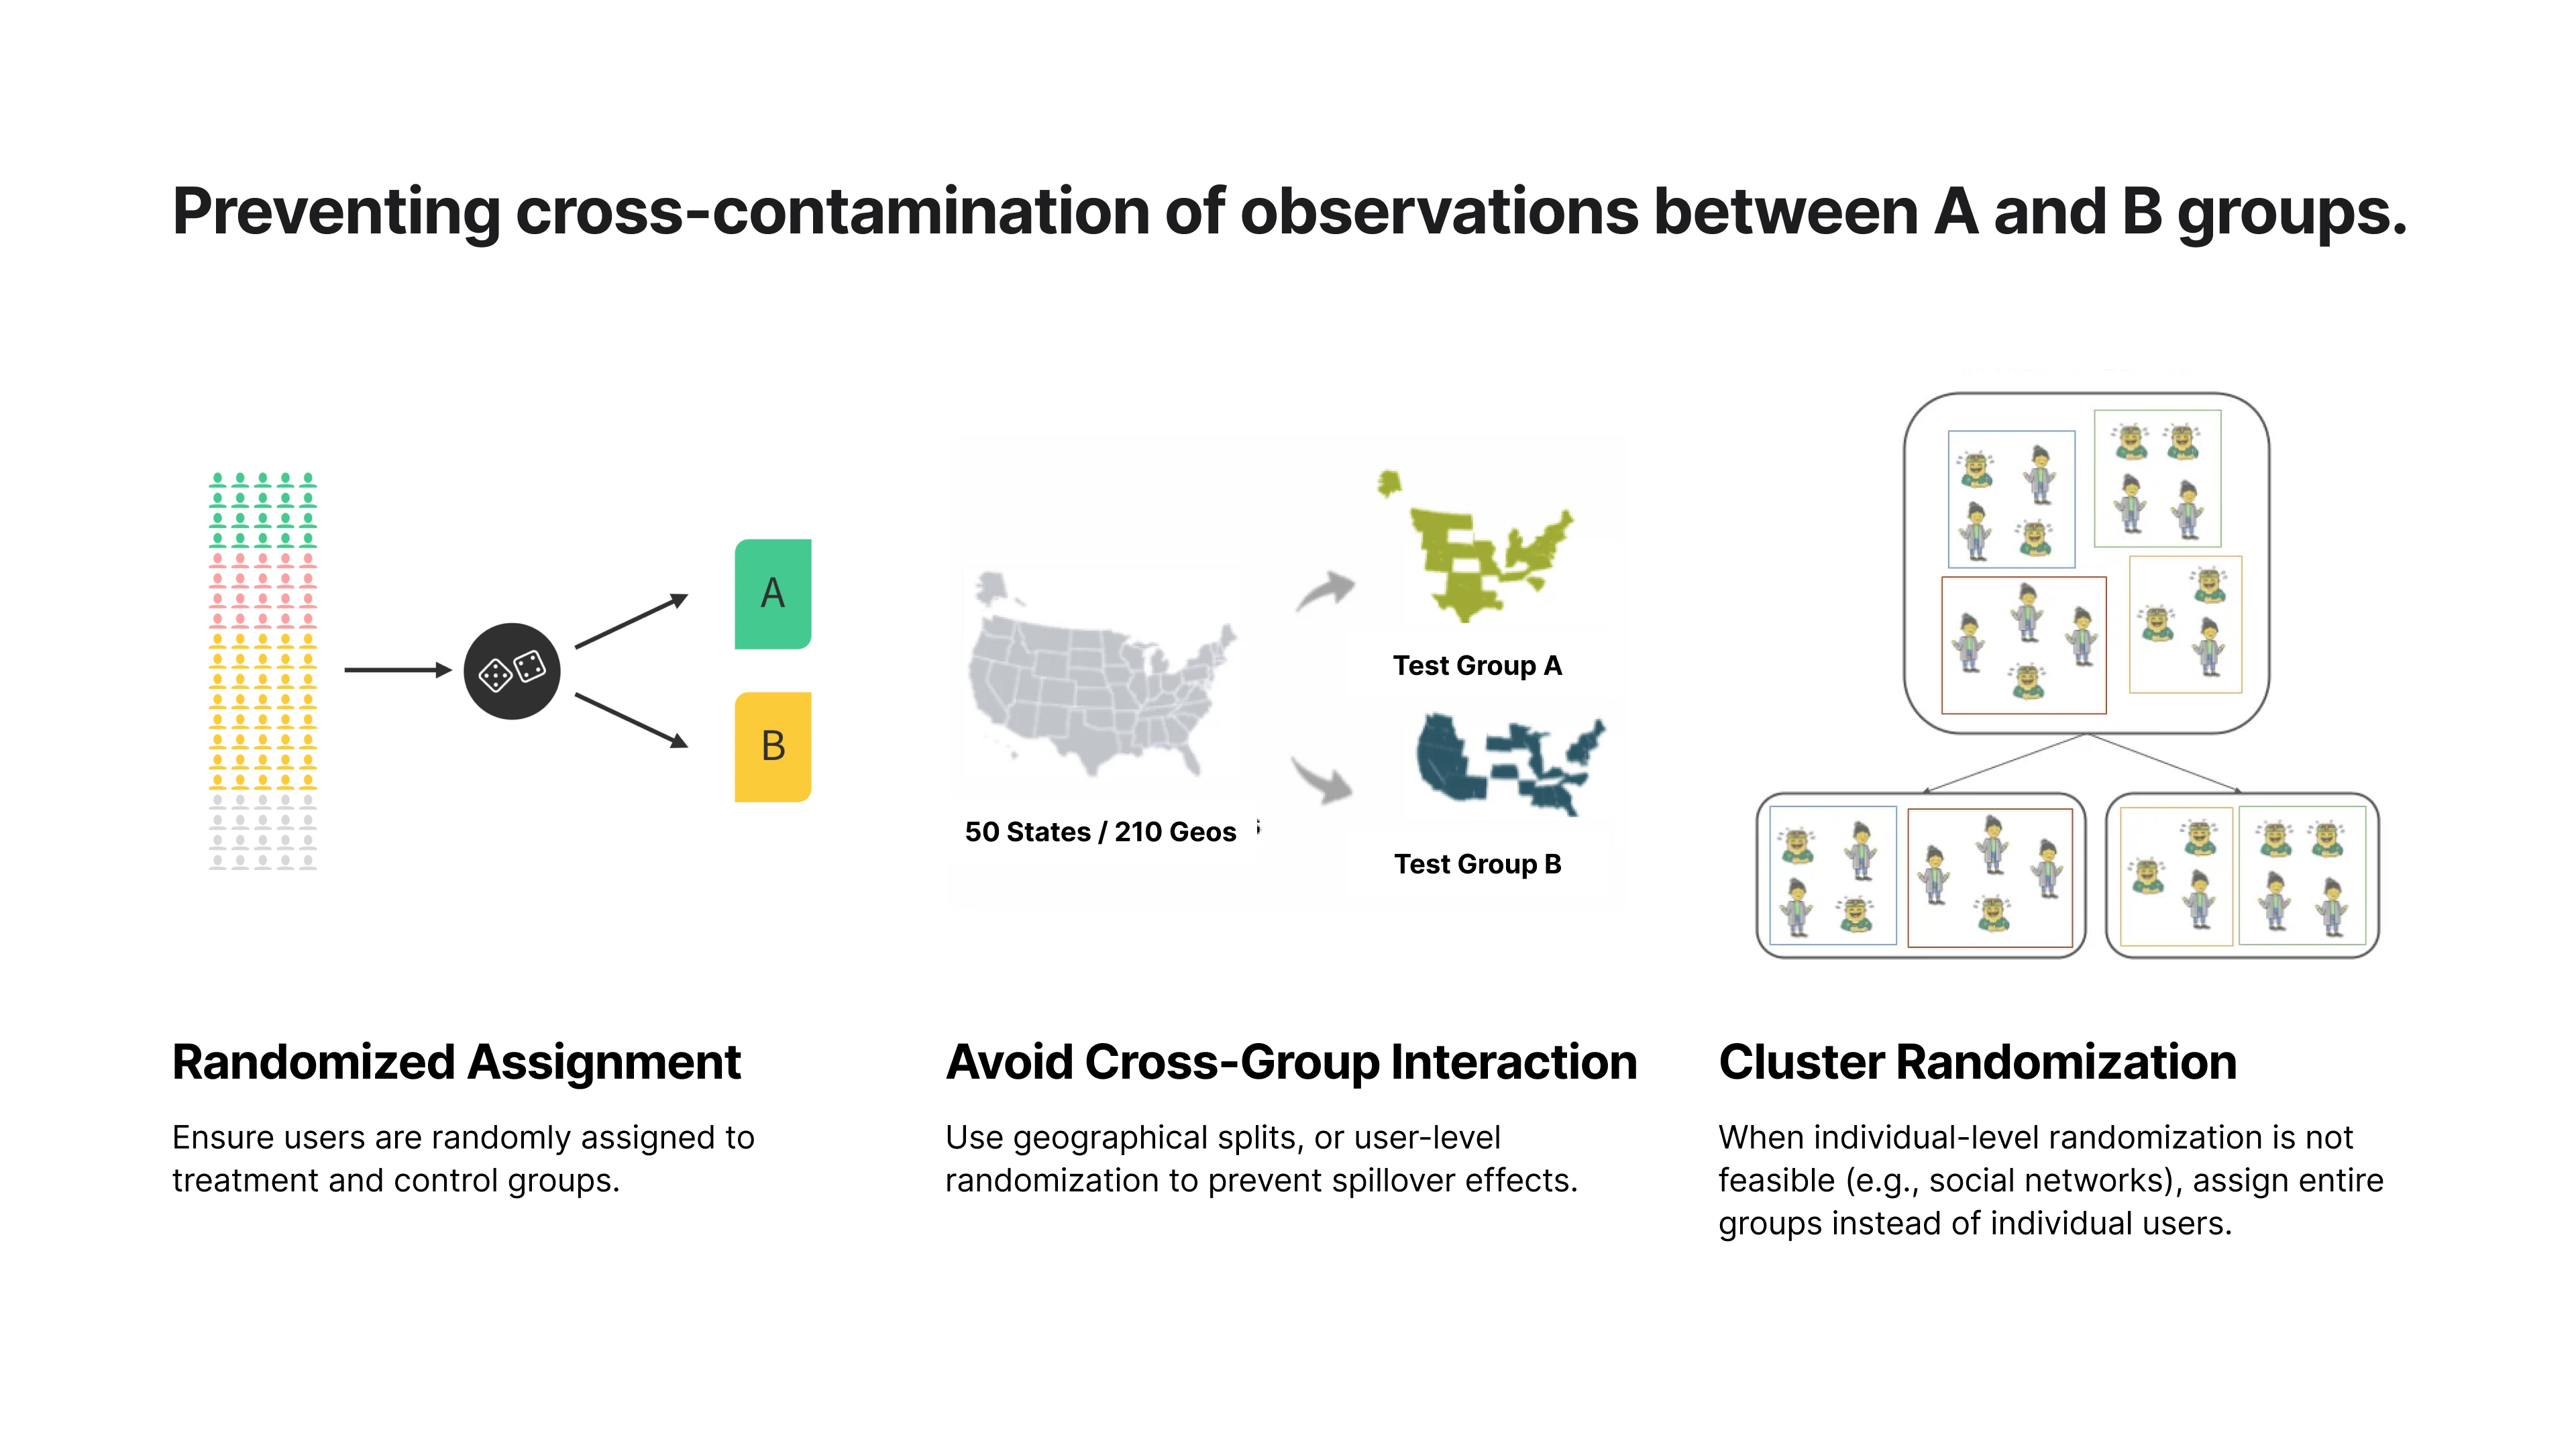
Preventing cross-contamination of observations between A and B groups.
To tackle these challenges, we need to prevent cross-contamination between A and B groups.
First, we randomly assign users to either the group (A) or the group (B). This way, we ensure a fair comparison and remove potential bias.
In some cases, randomization alone isn't enough. If users in Group A and Group B are in the same region, they might still influence each other. A better approach is to split users by region—for example, testing in one city vs. another—to minimize interference.
For apps with strong social or network effects, individual-level randomization doesn't work. A user's experience is heavily influenced by their connections. In this case, instead of assigning individuals, we assign entire groups—such as a full social network, city, or pair—to the same variant
Distinguishing Between Real Treatment Effects and Random noise
To separate real effects from random noise, we need to make sure our sample size is large enough.
Why? Because small sample sizes tend to create more random fluctuations, making it harder to tell whether a change is actually working.
Running the test for long enough (usually at least two weeks) helps smooth out short-term ups and downs.
But how do we know if our sample size is enough?
This is where power analysis comes in—it helps us figure out the right sample size before we start the test.
We won't dive into the math, but here are the key things you need to focus on:
Baseline Conversion Rate
This is the historical conversion rate of our original version. It gives us a benchmark for detecting changes.
- Just like it's easier to spot trends in a busy store than in an empty one,
- Higher baseline conversion rates help A/B tests detect meaningful changes with fewer visitors.
Minimum Detectable Effect (MDE)
This is the smallest change we want to detect.
- A good starting point is 5%.
- For high-traffic sites, we can lower it to 1-2%.
- For low-traffic sites, we may need to increase it to 10%.
The trade-off is that smaller minimum detectable effect → larger sample size needed.
Think of it this way: if someone changes their hair to blue, you'll notice immediately (big change = fewer observations needed).
By setting the right sample size and Minimum Detectable Effect, we ensure our A/B test gives us results we can trust
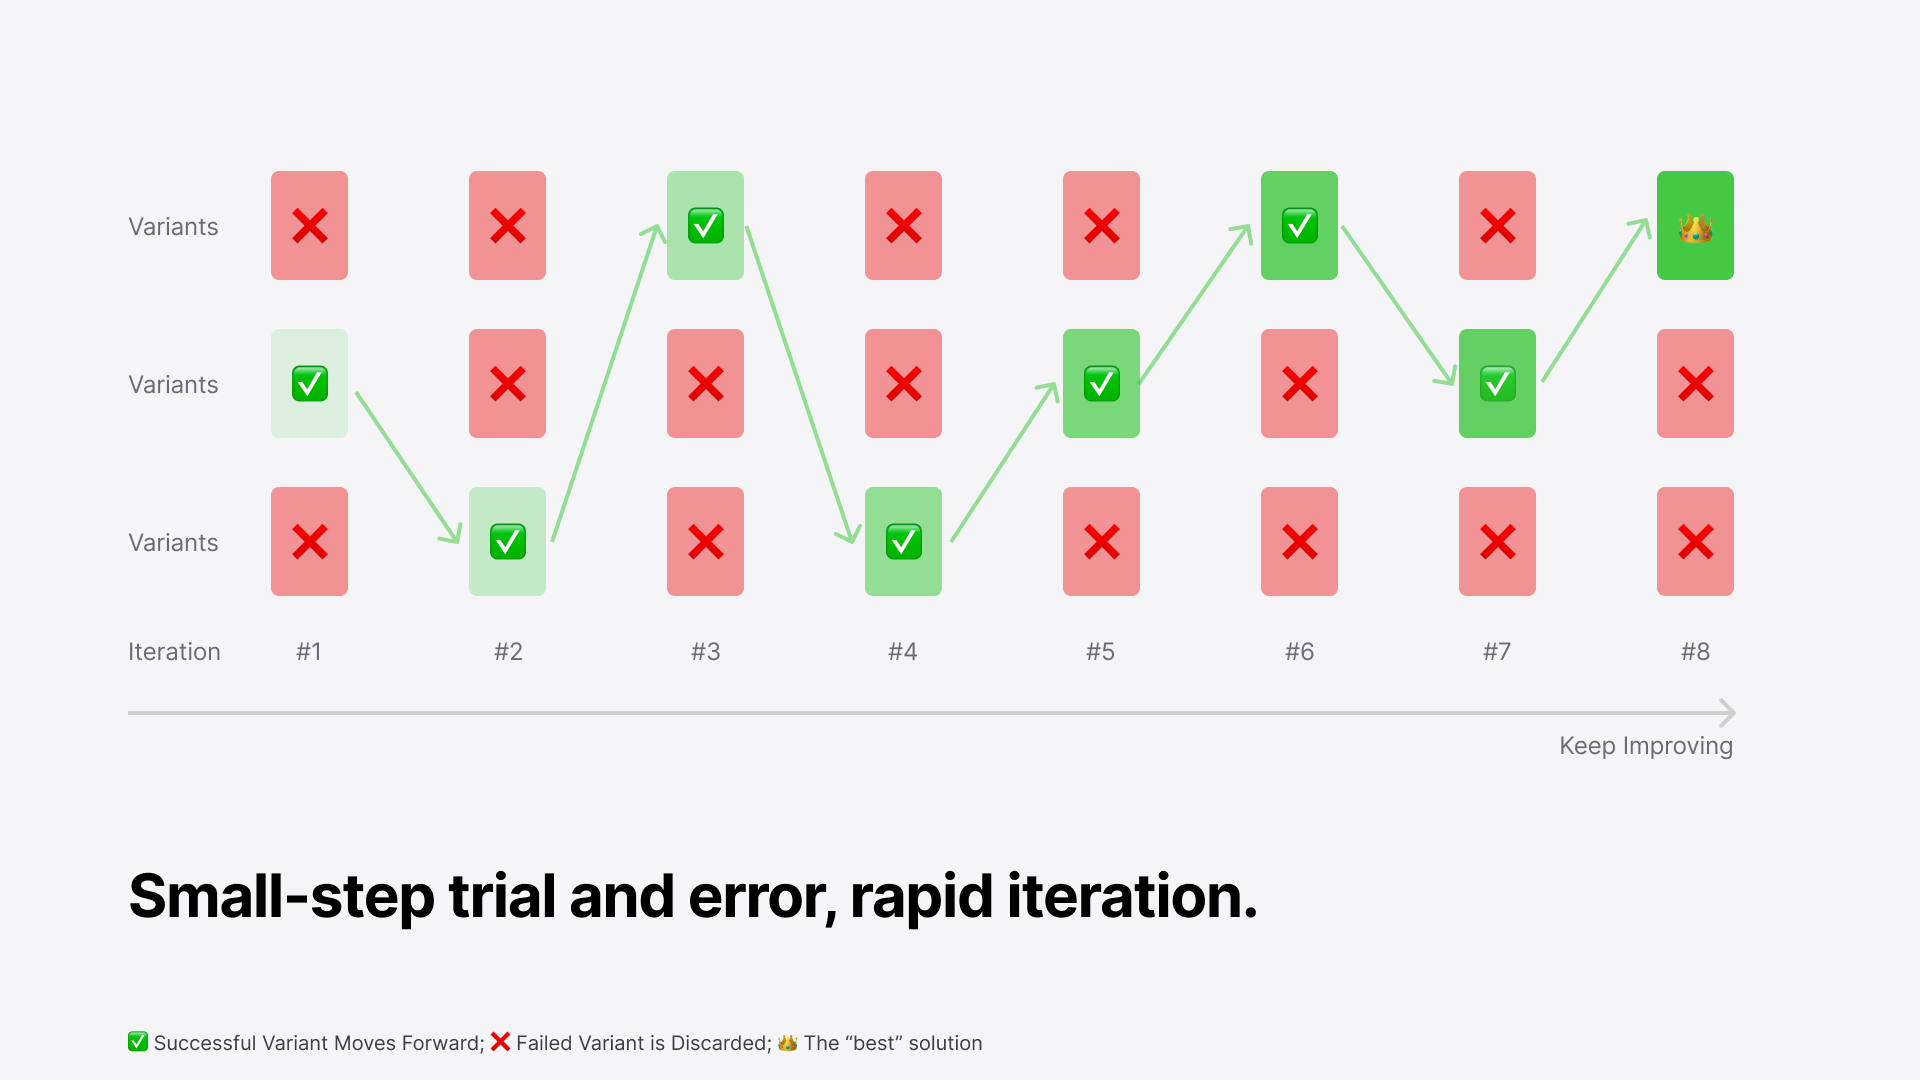
Zen of AB Testing
At the heart of A/B testing is the idea of small-step trial and error and rapid iteration.
This is especially useful in industries that change quickly. Instead of trying to come up with the perfect solution right away, A/B testing helps us make small adjustments based on real user feedback. Each little experiment helps us figure out what works a bit better, and over time, we build up small wins that lead to much bigger gains.
Reminder: AB Testing is not silver bullet
It can sometimes foster a 'conversion-first' mindset. While positive results from the test may show an increase in conversion rates, they don't always guarantee a better user experience. In fact, those conversions could come at the cost of creating a less enjoyable experience for the user.
Additionally, A/B testing typically focuses on current user preferences and short-term data. It's critical to remember that each experiment should be designed with the long-term goals and vision of the business in mind, ensuring that the changes tested contribute to sustainable value rather than just temporary gains.
A/B testing will only tell you if a strategy is acceptable, but it doesn't explain why users prefer one option over the other. So, it's important to keep asking why users made that choice. In this way, you can gain valuable insights that help you understand your users.